The Real Size of Residential Proxy Pools
Ever wondered how big residential proxy pools really are? And if they’re really residential? We tested the largest providers to find out.

This is a technical research report that will give you an idea of how diverse and robust residential proxy network IP pools actually are. It’s the only test of its kind that we know of.
Is there a difference between two proxy networks that claim to have ‘millions of proxies’? Since we released our proxy market report in March, several proxy providers have increased their proxy network – some as much as ten times.
500,000 to 7 million in a week, 23 million to 62 million in a month, 60 to 72 million a week later… Who can keep up with all these numbers?
This got us thinking: marketing aside, how much do these vast numbers actually mean to proxy users? Can you notice them when moving from one provider to another? Are you really getting what you paid for? These questions intrigued us, and we decided to do something about them. Proxy pools were just begging us to jump in.
Since we couldn’t really know how most providers determine the size of their networks, we wanted to use one of our benchmark tests from the annual report – Unique IP percentage – and put it into overdrive.
Pool sizes might mean daily, weekly or even monthly unique proxy servers.
Our Assumptions
In our experience, there are several things you have to consider about a proxy network’s pool size:
1. It’s not a fixed number, it fluctuates every day.
Most proxy pools are actually small enough on a daily basis for us to reach a threshold where IP addresses start to repeat. We figured that sending hundreds of thousands of requests per day could give us an idea about how many unique proxies were in each pool.
2. Only an IP database can tell you whether a proxy is good.
We automatically sent the IP information to two IP databases, which returned a lot of data about the proxies. A majority of internet services use these or similar databases, so they can give a good sense of how great any network actually is.
3. Not every proxy is created equal (are some providers faking it?).
This is where we got a bit sensational: since we were going to review IP data in multiple databases, it let us detect residential proxies, data center proxies,and other niche types of IP addresses, like DC proxies registered with internet service providers (ISPs). We decided to include this, as well as C-class subnetworks. Mind you, we were testing explicitly residential proxy providers. In our experience, clients often choose residential IPs to avoid subnetwork blocks.
4. You have to be open and transparent to get any real data.
We weren’t trying to hoodwink anyone with our tests. Since many providers have separate proxy pools for, say, US proxies, we asked them nicely to lend us access to their main proxy pool. Most agreed, which helped us greatly. Others didn’t, and so we had to buy proxy access ourselves. In those cases, we chose plans and used endpoints that gave access to the largest number of IPs worldwide. Some providers even helped us by monitoring and providing more suitable gateways for our tests (thanks, NetNut!).
Providers Tested
With limited time and resources at hand, we decided to focus on the following residential proxy providers:
- GeoSurf
- Oxylabs
- NetNut
- Smartproxy
- Luminati
- RSocks
- PacketStream
Transparency Notice
We reached out to every proxy network in advance. They all had the opportunity to give us access to their best proxy pools. We answered any questions about our testing scripts, target servers, and testing benchmarks.
Some providers really showed their best side and gave us some traffic to use. Our thanks goes out to NetNut, Smartproxy, Oxylabs, RSocks, and GeoSurf for their help.
Methodology
We used an in-house script for the tests. It’s built on Python and uses:
- AIOHTTP – a library for making HTTP requests.
- MaxMind – an IP database we used for mapping the ASN, country, and city of the proxies.
- IP2Location – another IP database we used to map proxy types and IP information to cross-check MaxMind’s data. Since their data about ASNs and locations did not line up, we avoided adding this information in the results. Instead, we chose to resolve and check the C-class subnetwork masks of the IP addresses.
Our goal was only to rotate proxies against a target. So, there was no need to pit them against a site like Google to see how the IPs perform. Instead, we decided to use a generic Cloudflare server as a testing ground.
We couldn’t dream of sending hundreds of millions of connection requests and not going bankrupt, so we only tested the providers for 5-7 days. We then took the best performing 400K connection requests over 3 days as the most representative samples. We did this because we’re sometimes clumsy and initially had some issues setting up our script properly.
We believe this is enough to create a solid benchmark that could give any proxy user an idea of how diverse any IP pool was.
The testing method itself was straightforward: we sent 10 concurrent requests every second to the same server, while rotating the proxies each request. The server logged the proxy IP address and checked it in two IP databases. We then fed everything into a Grafana dashboard.
Things We Looked Into
This gave us several important data points to use in the pool research:
- How many unique IP addresses a proxy provider had
- How many of the IPs were under different C-level subnets
- If they were registered as residential ISP addresses
Let’s have a look at how each of the providers performed.
Results
GeoSurf
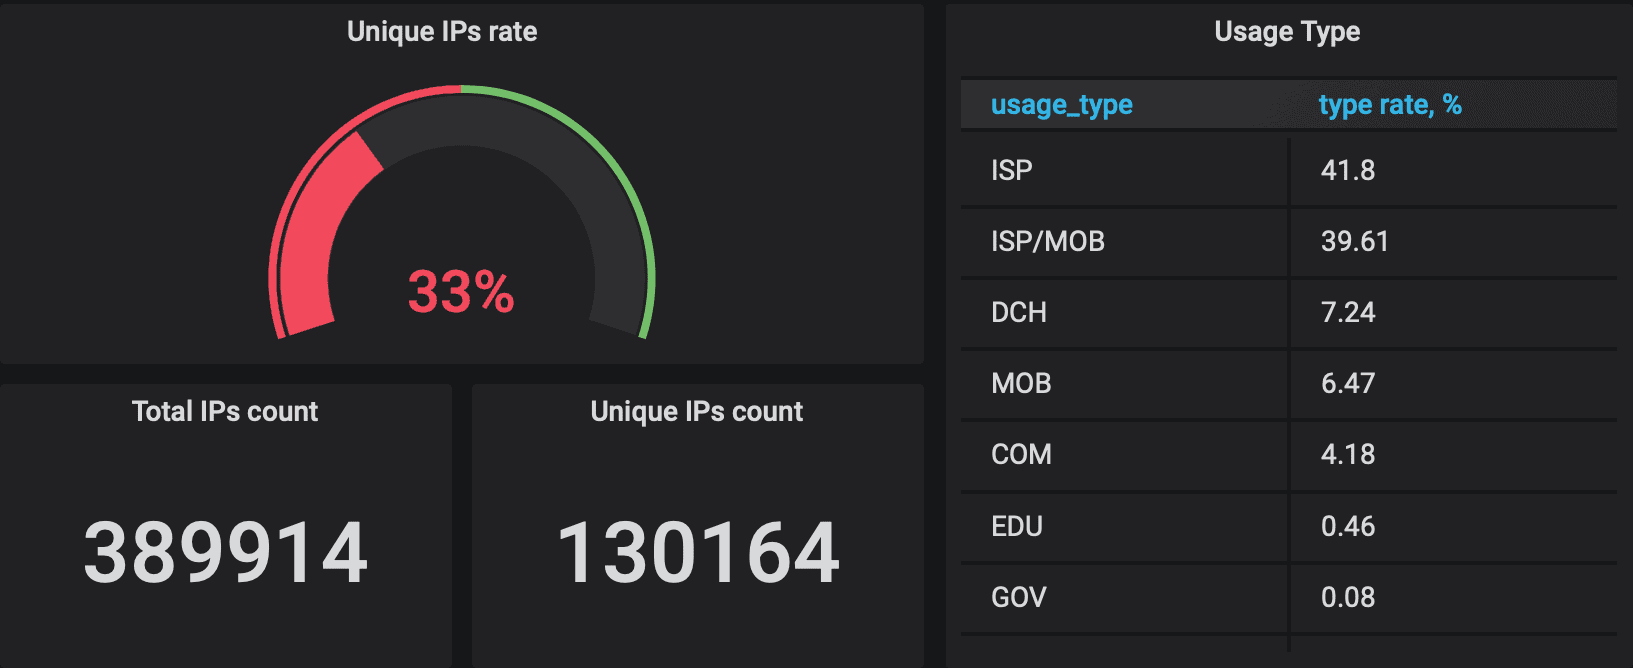
Geosurf claims to have around 2.5 million residential IPs under its control. During our test, we made almost 390,000 requests. 130,000 (or 33%) of them received unique proxies. This is a really good result considering Geosurf’s limited resources. Better yet, nearly 79% of those unique proxies had different C-level subnets.
Most of the tested proxies (87.88%) belonged to residential addresses, split almost equally between fixed line and mobile ISPs. Only 7.24% of the addresses were categorized as belonging to a data center, and the rest fell under commercial, educational, and governmental IPs.
Oxylabs
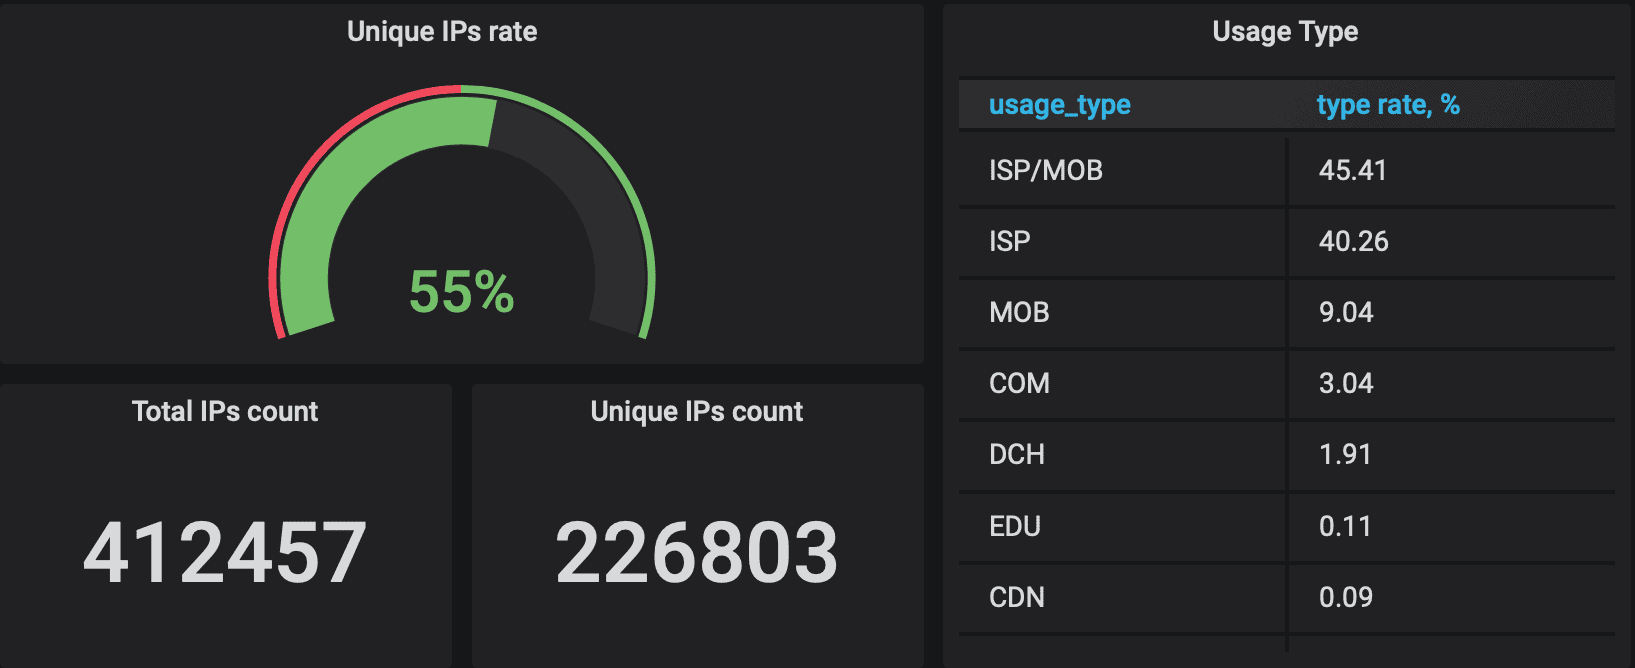
Oxylabs advertises to control over 60 million residential proxies. We sent over 410,000 requests and got 226,000 (or 55%) unique IP addresses – the second best result out of all our tested providers. 67% of them had unique C-class subdomains.
The database identified 94.71% of the unique IPs as either mobile or landline residential addresses. Oxylabs had the highest of purely mobile proxies in its residential pool, and only 1.91% of the IPs were classified as datacenter.
NetNut
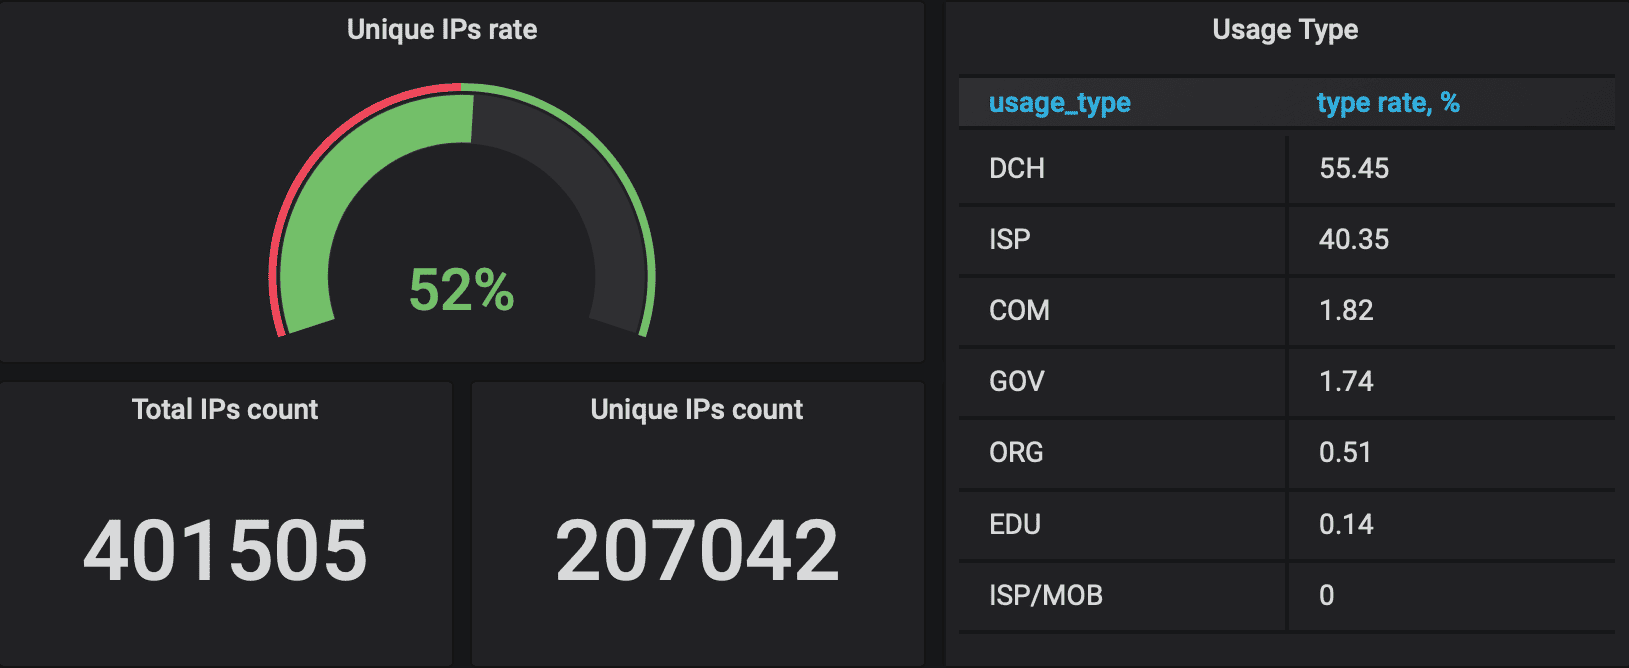
NetNut states it has 5 million residential proxies in its network. Out of over 400,000 requests we got 207,000 unique proxies (52%). This is a great result, but our C-class subnetwork tests revealed that only 0.5% had unique C-class subnets! That’s over 100 times lower than Oxylabs. To be fair, we approached NetNut focusing on IP quantity rather than uniqueness, so the provider might have optimized its pool accordingly.
The databases identified more than half (55%) of the unique IPs as originating from a data center. NetNut sells static residential proxies, so maybe it gets some of its IPs from small and unknown ISPs that haven’t made the database
Smartproxy
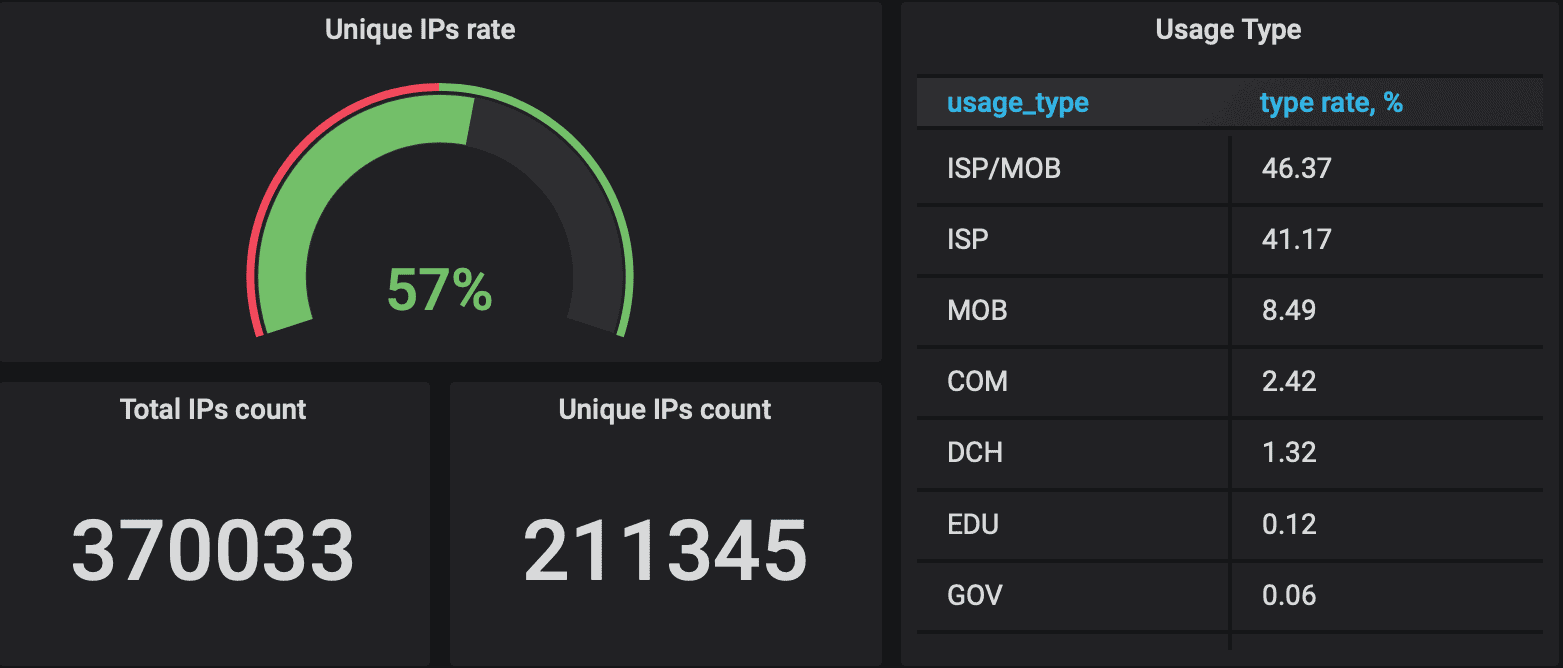
Smartproxy claims a solid 10 million proxy pool. A few days and 370,000 requests later we had logged 211,000 unique proxies (or 57%). Of all those requests, 37% had unique C-class subnetworks, which is a good number.
Almost 95% of the unique IPs turned out to be residential and only 1.32% were classified as datacenter in our databases. Looking at the results, Smartproxy did not disappoint and can truly call itself a residential proxy network. Over 8% were mobile ISP addresses.
These numbers are strikingly similar to Oxylabs. It leads us to assume that Smartproxy might be using the same proxy sources or potentially reselling. Let this be a lesson to us: next time we run a similar test, we’ll check whether any providers have duplicate proxy IP addresses.
Luminati
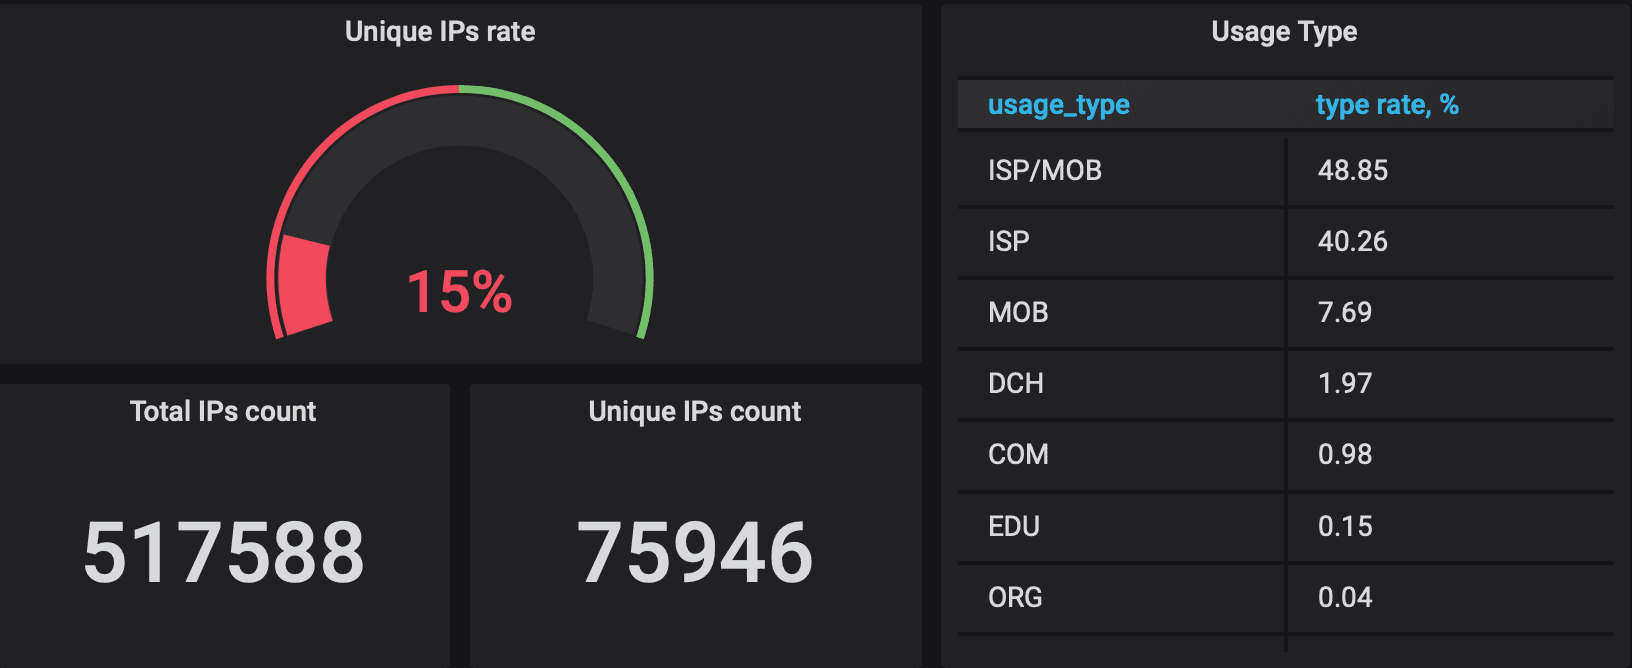
The giant of the proxy market states that it has over 72 million residential IP addresses in its pool. We sent over 500,000 requests and got a measly 76,000 unique IPs (15%). Of these, 84% were in unique C-class subnetworks. Disclaimer: Luminati did not give Proxyway explicit access to their whole pool, and we used one of our standard personal accounts for the tests. We suspect that our proxy pool might have been limited due to Luminati’s ethical use policies.
IP databases showed that over 95% of Luminati’s pool were mobile and residential proxies, while almost 2% were DC IP addresses. Another important note – the pool had over 7% mobile IP addresses.
RSocks
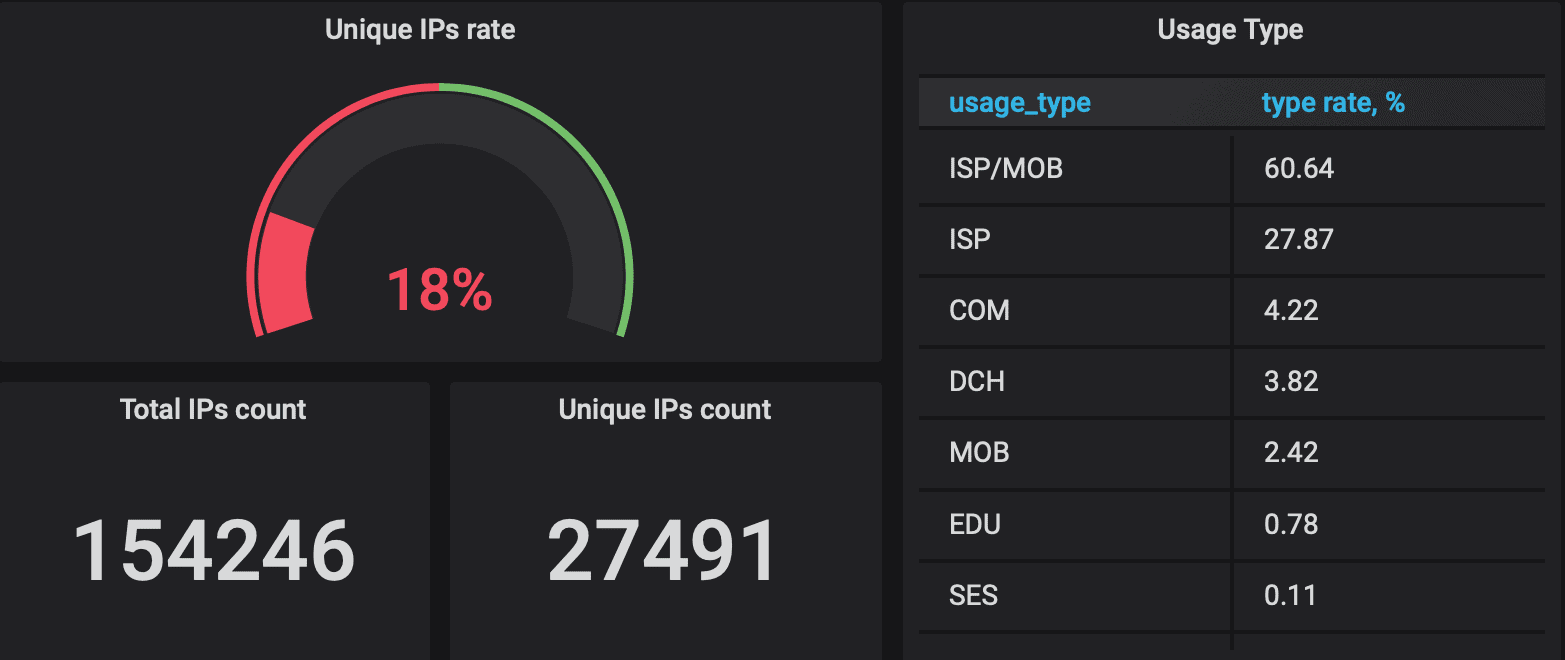
RSocks claims to have over 3 million residential proxies. The plan we received should have had 54,000 unique IPs (a third of which change every three hours); and it returned 27,500 unique proxies for over 150,000 requests (18%). This is still a better percentage than Luminati, but it shows that RSocks has a smaller network. Unique C-class stats: 66%, a solid number.
RSocks also passed IP database checks with close to 90% residential (ISP and mobile) addresses. Just under 4% showed up as data center IP addresses.
PacketStream
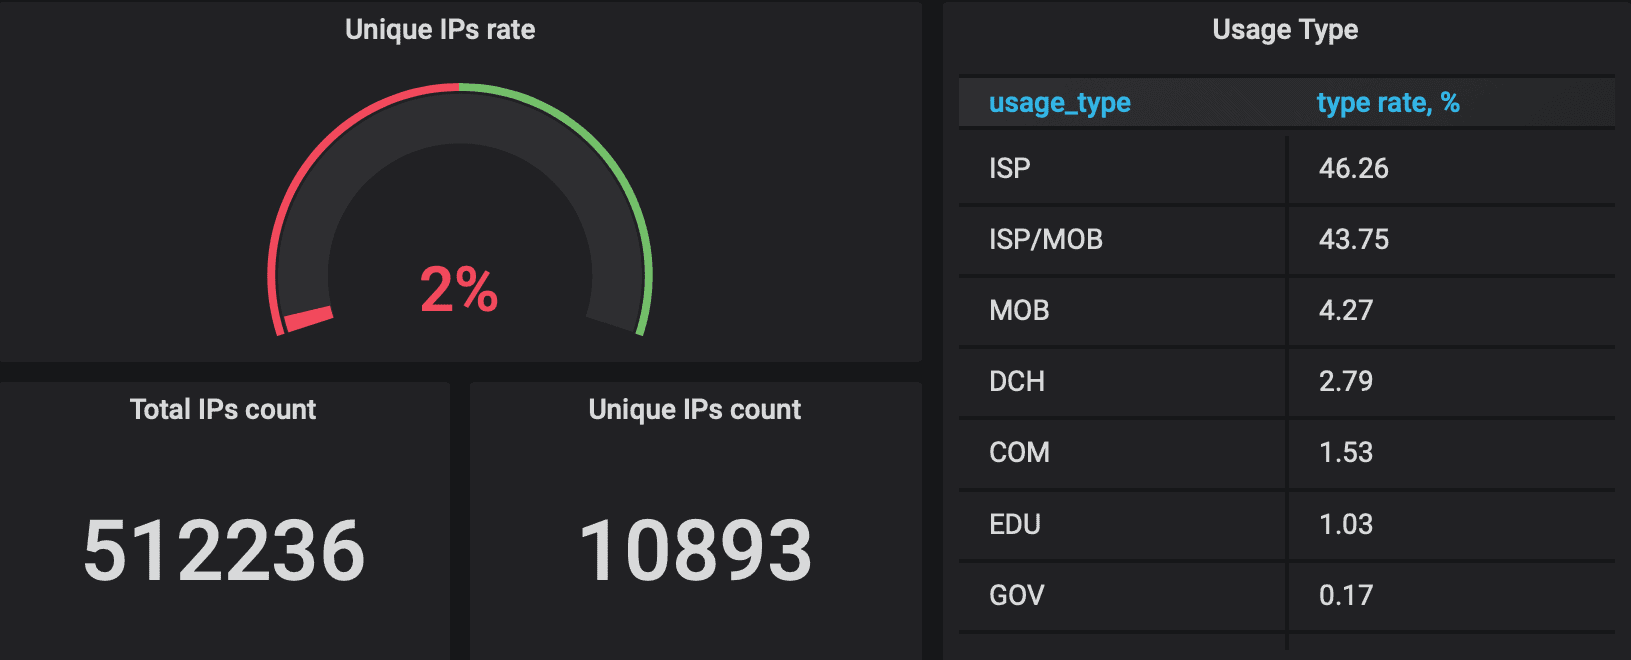
Our newcomer of the year claims to have 7 million proxies. But, unlike RSocks, for 500,000 requests it provided only 2% of unique IP addresses. On the bright side, the IPs were under nearly 100% unique C-class subnetworks.
Packetstream’s pool included over 94% of ISP and mobile IP addresses. These are very solid numbers, but the scale of the network left us disappointed. Curiously, even Packetstream had close to 3% DC proxies in its pool.
Key Takeaways
- Only three providers had more than 200K unique IP addresses per 400K connections: NetNut, Oxylabs, Smartproxy.
- Of those three, NetNut had a microscopic number of unique C-level subnetwork addresses, likely because it takes proxies directly from ISPs. This means most of the proxies we used share subnetworks and therefore could get blocked.The test data show stark differences in the quality of popular proxy pools.
- The rest of the proxy providers did not have a robust-enough IP pool to handle hundreds of thousands of requests with over 50% unique IP results.
- Proxy tests need to be even more robust to show the real scale of these networks, but our results let us claim that several networks were almost 200% larger than others during the testing period.
- Even if proxies show up as residential IP addresses, connecting with many addresses from the same C-level subdomain can lead to more blocks.
All in all, proxy networks most likely do not have millions of proxies at any given time. It is highly likely that they calculate the size of their proxy pools over an extended period. We recommend asking providers about how exactly they determine the size of their proxy pool before making a purchase.
To learn more about the proxy networks, please read our extensive provider reviews based on technical test data. Proxy pool sizes constantly fluctuate, and they should not be the sole factor in making a decision. If you need proxies for web scraping or other popular use cases, you can read our extensive 2020 Proxy Market Report.